
How to Chart Sun in Your Garden?
Sun charting in your garden isn’t complicated at all and can be pretty fun, in fact.
Why would you need to map the sun out?
It’s not just because some plants like sun better than shade and others prefer shade.
It’s about creating a functioning and diverse ecosystem, which will, in the end, benefit not just plants, but pollinators and you in many ways I talk about here.
Strategically placing sun-loving, flowering plants where morning sun hits will make them open up early, and that will provide a good breakfast for the bees that wake up early.
Planting more cold-resistant plants in cold pockets and drought-resistant ones on sunny slopes means you will use way less water to keep them alive.
Minding vegetable sun needs will allow you to have bigger harvests.
Slugs will prefer shady and moist spaces, so planting slug-resistant plants in those will save you some nerves.
You get the idea.
Now, let’s get to the charting.
Sun charting method.
There are a couple of methods, but I find this one the easiest.
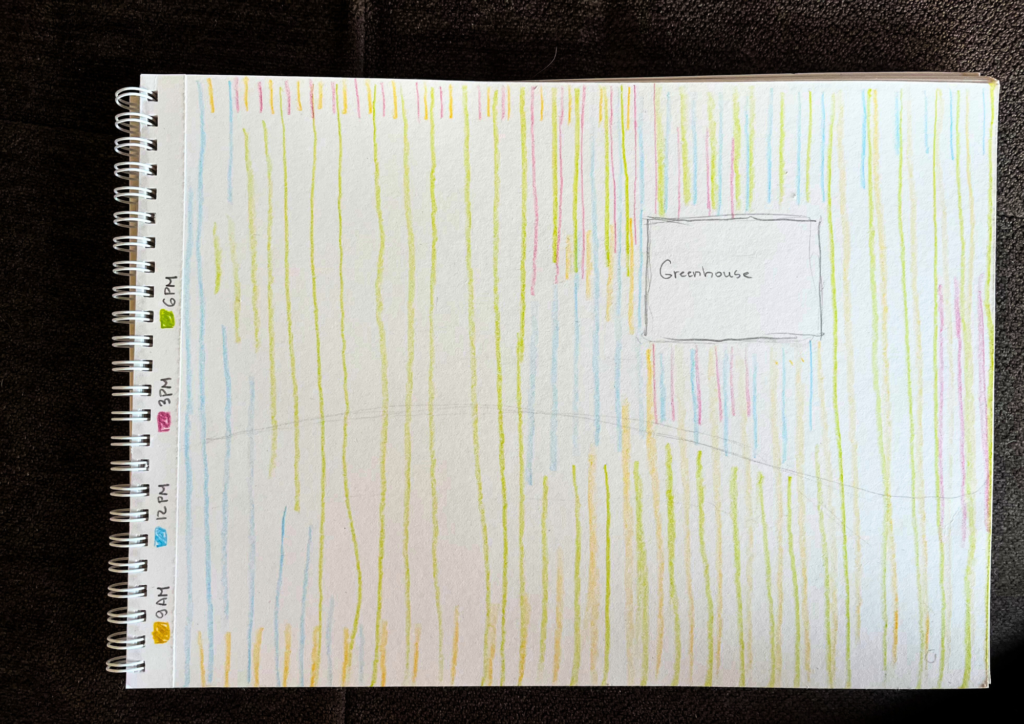
You draw a map of your garden. You can draw it as detailed as you wish, but for the purpose of this exercise, I made it very simple and only marked my greenhouse, without crowding it with trees and bushes. I also drew a faint line to indicate a slope border.
You’ll need 4 different colored pencils.
Go to your garden at 9 AM, 12 PM, 3 PM, and 6 PM, each time drawing lines where the shade is, each time with a different color. Don’t forget to note which color corresponds to which hour.
This is what I ended up with. Notice I marked the colors corresponding to hours along the left edge.
If you don’t have colors, just create a pattern for each hour (dots, wavy line, horizontal line, vertical line).
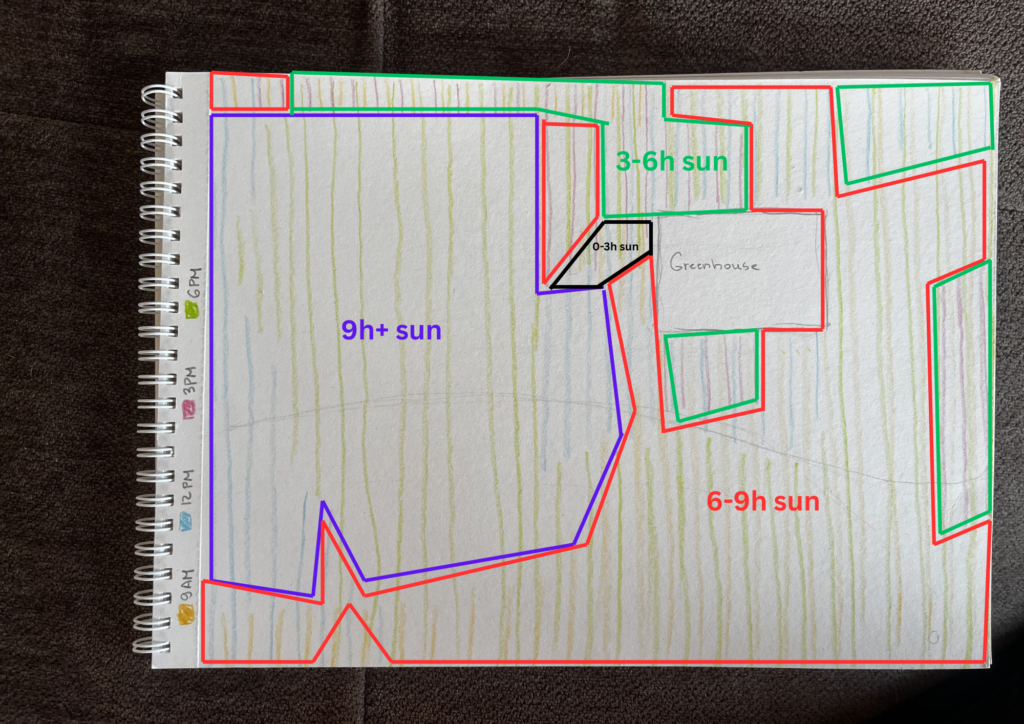
In the end, wherever most of your lines intersect, those spots are the shadiest ones.
Basically, the places with only 1 color will have 9+ hours of sun,
2 colors – 6 to 9 hours of sunshine,
3 colors – 3–6 hours of sun,
4 colors – 3 or fewer hours of sun.
Here is my map again, marked. You can clearly see how the greenhouse affects the sun, with areas around it being the shadiest. There are some tall bushes along the top there and a building on the right side that result in less sun.
This was also made right now, in early spring, and for best results, you would have to do it in late spring to summer, during your growing season.
That’s it. To be even more accurate, you can go out more than 4 times per day. You can go out and chart until you run out of colors in your pencil case.